Table of Contents
Financial Reports Connect to QuickBooks Financial Reports Rows Navigating Financial ReportsFinancial Reports
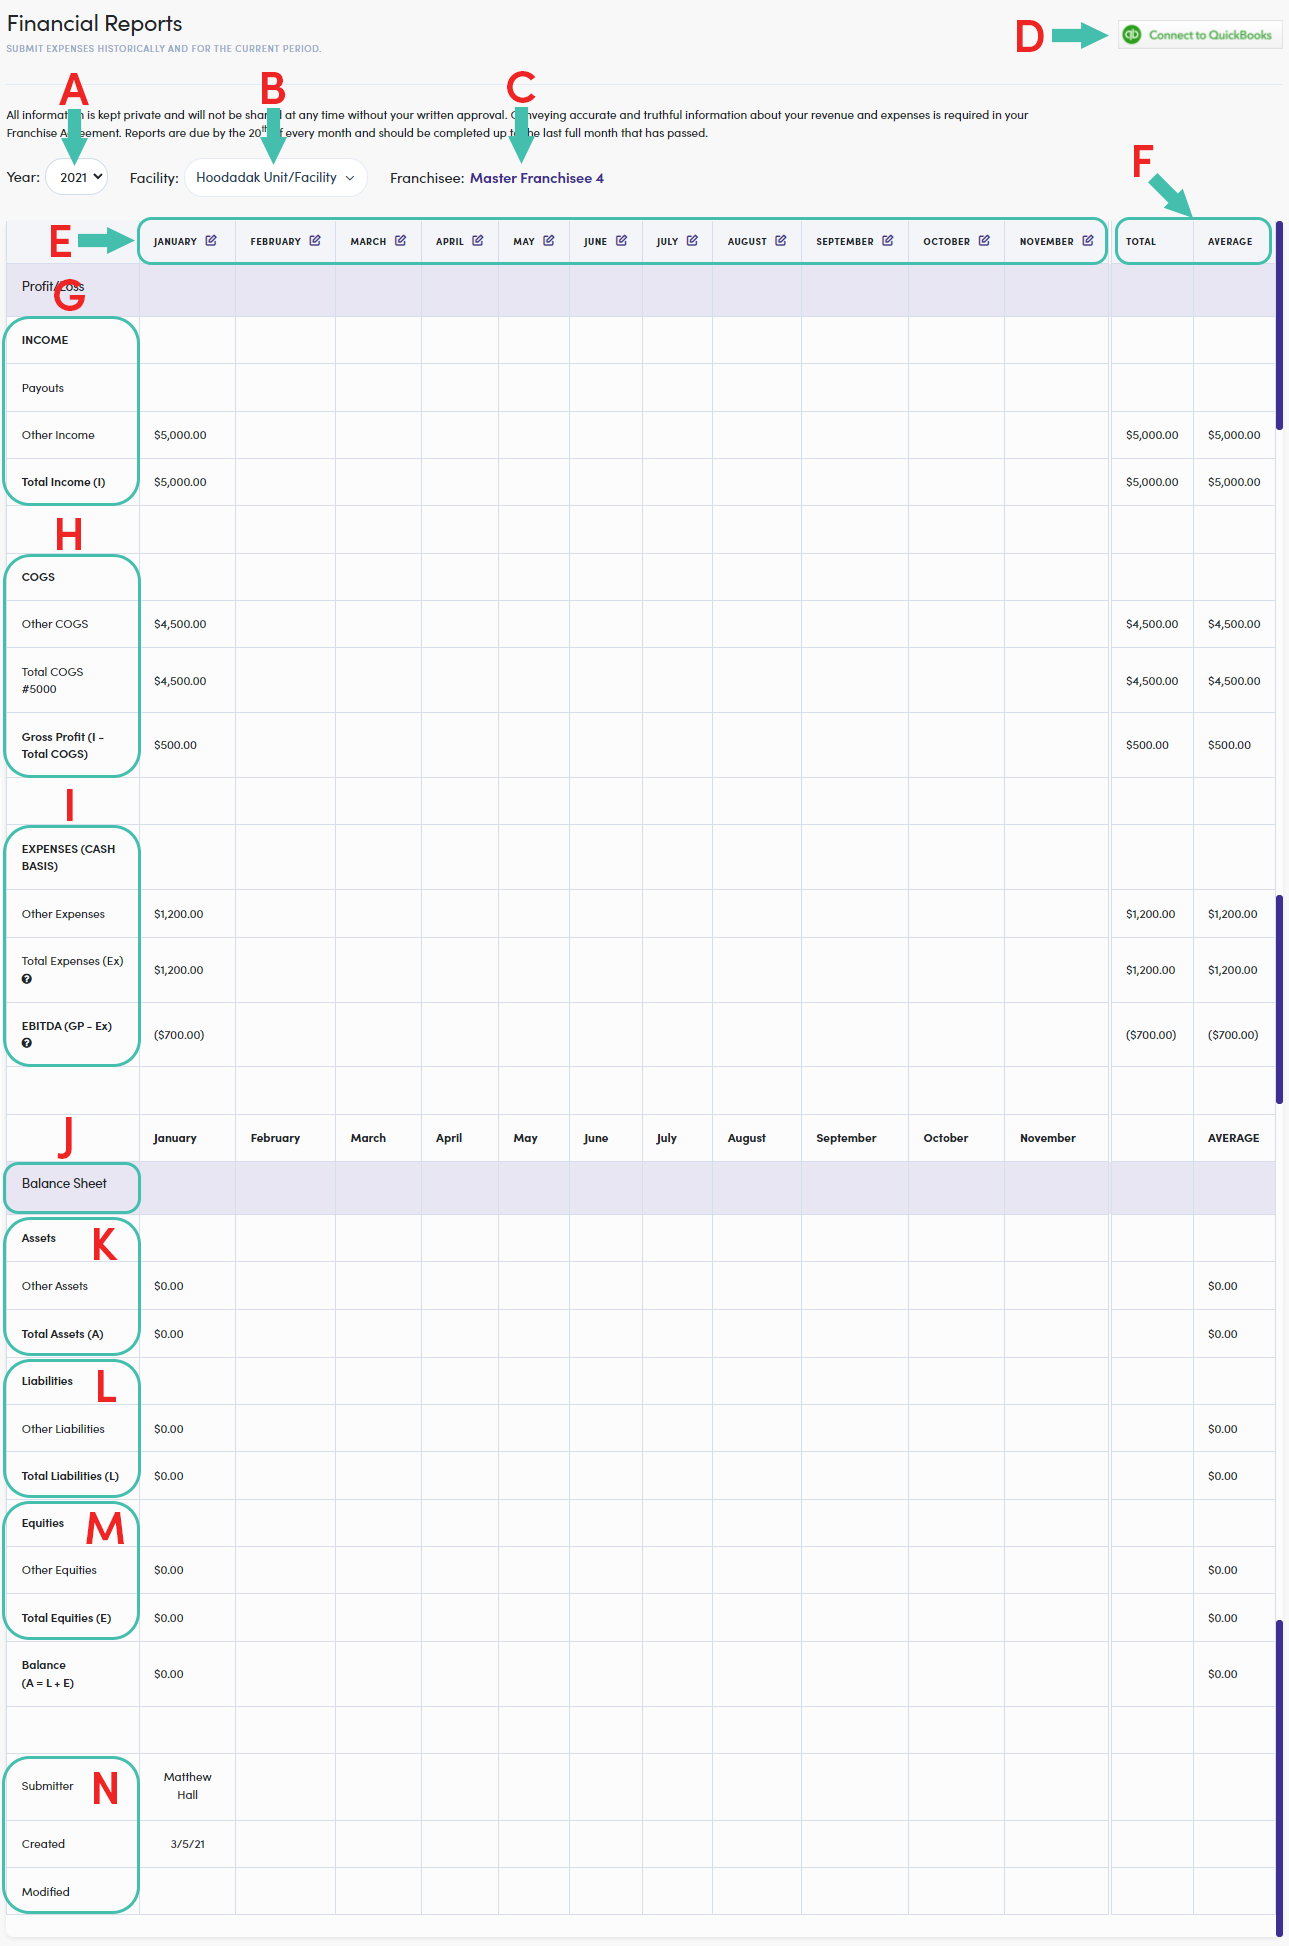
The Financial Reports report is a comprehensive annual view of revenue and payouts broken down into monthly columns. Having transparency into your finances gives you the power to be in the know where it counts.
Clicking on Financial Reports from the "Reports" menu (left-side) launches the report.
Connect to QuickBooks
The "Financial Reports" details are pulled from your linked QuickBooks account. Click on the  link, in the upper right-hand corner of the report window. This will launch a new window where you will log into your Intuit portal and complete the connection process.
Financial Reports Rows
The details of this report are broken down into line items by vertical rows. Lets breakdown what data is found in each row:
| Row | Description |
|---|---|
| INCOME | "Income" section header |
| Payouts | Financial payouts to the business |
| Other Income | Other amounts of income coming in |
| Total Income (I) | Total of Income line items |
| COGS | Cost of Goods Sold ("COGS") section header |
| (Compensation Cost) #5100 |
Example of COGS line item may include such items as "compensation cost" |
| Other COGS | More COGS line items may be added |
| Total COGS #5000 |
Total of COGS line items added |
| Gross Profit (I - Total COGS) | Total of COGS subtracted from "Total Income" |
| EXPENSES (CASH BASIS) |
"Expenses" section header |
| (Advertising) #6000 |
Example of Expenses line item, these may include such items as "advertising", "Insurance", "rent", etc. |
| Other Expenses | Uncategorized expenses |
| Total Expenses (Ex) |
Total of Expenses line items added |
| EBITDA (GP - Ex) | Earnings Before Interest, Taxes, Depreciation, & Amortization ("EBITDA"), Total from Gross Profit line minus Total Expenses |
| Balance Sheet | 2nd Report of the "Financial Reports" (Continuation of sheet) |
| Assets | "Assets" section header |
| (Cash in Bank) #1000 |
Example of Assets line item, this may include items like "Cash in bank" |
| Other Assets | Uncategorized assets |
| Total Assets (A) | Total of Assets line items added |
| Liabilities | "Liabilities" section header |
| (Credit Cards) #2200 |
Example of Liabilities line item, these may include such items as "business loans" and "mortgages" |
| Other Liabilities | Uncategorized liabilities |
| Total Liabilities | Total of Liabilities line items added |
| Equities | |
| (Owner Contributions) | Example of Equities line item, this may include such items as "owner contributions" |
| Other Equities | Uncategorized equities |
| Total Equities (E) |
Total of Equities line items added |
| Balance (A = L + E) |
Calculation (or balance) of Liabilities + Equities. This should balance to $0.00 |
| Submitter | Name of individual submitting report |
| Created | Date report is created (due by or before the 20th of each month) |
| Modified | Date of last (if any) modification is made to report |
Navigating Financial Reports
Here is a detailed breakdown of viewing the Financial Reports report:
- Year of report selection (dropdown)
- Facility Selection (dropdown)
- Associated Franchisee (to Facility)
- Connect to QuickBooks (button)
- Monthly columns
- Manual input of report data via

- Manual input of report data via
- "Total" & "Average" columns
- Total/Average of the associated row
- "Income" entry section
- "COGS" entry section
- "Expenses" entry section
- "Balance Sheet" Report section break
- "Assets" entry section
- "Liabilities" entry section
- "Equities" entry section
- Report author and date(s)